SageModeler Quick Intro
Follow the instructions below or watch a short instructional video to learn how to build your own model.

Note: This software is under development! Please feel free to send feedback or report bugs. Thanks!
Make a diagram
Consider what you want to model. Perhaps you’re thinking about the factors involved in climate change or variables that affect water quality in your local river. Want to diagram your understanding of a predator-prey relationship?
What images do you want to include in your model? (Hint: If it’s something very abstract, use the blue box icon.)
- Click the “New Image” icon in the upper left of the SageModeler tool or drag the icon onto the canvas.
- Search for an image using the Image Search (which searches for public domain images on openclipart.org).
- Once you’ve located an image, click Add Image to add it your palette.
- Search for additional images or close the “Add New Image” box.
- Now drag the image from the palette to the canvas.
Add connections
After you’ve added images to your canvas, connect them with links to show which variable affects the other. Select an image, click the arrow, and drag it to another image, then release.
Create relationships
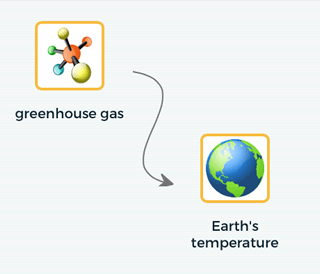
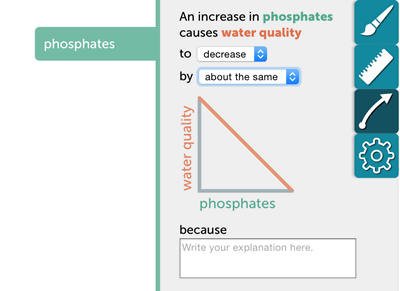
You’ve added images and links – great! Now, define relationships by clicking a variable (image), then the arrow icon (relationship inspector) in the inspector palette. For instance, what do you think would happen to the Earth’s temperature if greenhouse gases increase? Or what would happen to water quality if there’s an increase in phosphates?
Simulate your model
After you’ve set all the relationships, it’s time to run your model and collect data.
-
Click the Simulate arrow in the upper right of the window, which will start simulation of the model and expand to display data recording options. You can now adjust model variables by changing their slider handles.
-
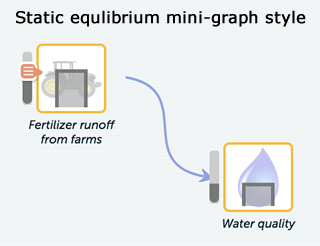
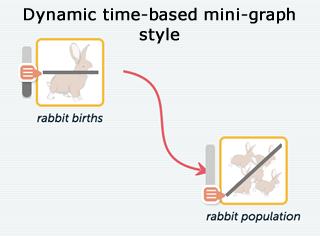
In static equilibrium models the graphs show bars that represent the state of each variable in the model. In dynamic time-based simulations the graphs show how the variables change over time. (See explanations for different modeling modes below.)
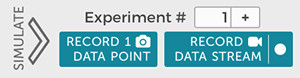
In static equlibrium models you can record one data point or record a data stream, which allows you to record all of the variables as you make changes in real time. It is recommended to increment the experiment counter each time you explore the impact of a new variable.
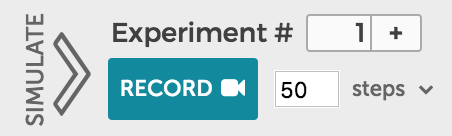
In dynamic time-based models you set the input variables and how many steps the model should calculate. Pressing record saves the values for all variables for each step the model calculates. It is recommended to increment the experiment counter each time you explore the impact of a new variable.
Add a graph by clicking the icon in the upper left panel.
Configure the graph by dragging variable names to the graph axes or click in the graph axes to set variables.
Explore your data
Because SageModeler is embedded in CODAP, you can explore data with tables, graphs, and more. Check out the CODAP help videos.